Drawing Rectangle Like Shapes
Rectangle-like Shapes
Functions that draw rectangle-like shapes include:
arc()chevron()ellipse()parallelogram()rectangle()rhombus()trapezoid()triangle
Rectangle-like shapes in Drawlib are defined using X, Y coordinates along with width and height parameters.
These shapes, such as arc() and ellipse(), resemble rectangles in their parameterization despite their curved appearances, hence they are categorized as rectangle-like shapes.
arc()
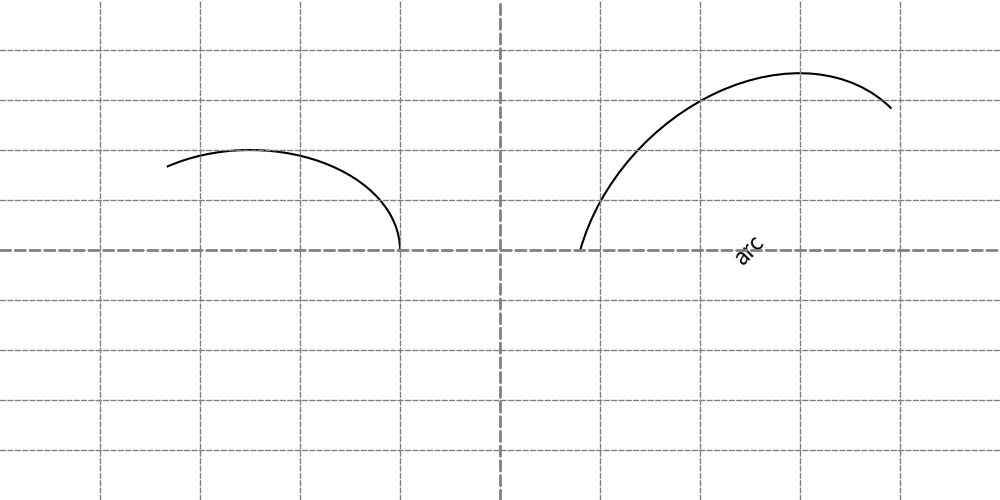
The arc() function is used to draw arcs.
An arc resembles a line but is drawn as a shape, thus arrow styles cannot be specified.
However, you can define the line style using attributes of ShapeStyle.
This function requires the following arguments:
xy: X, Y coordinates
width: Width of the underlying ellipse
height: Height of the underlying ellipse
from_angle: Starting angle of the arc
to_angle: Ending angle of the arc
angle: Rotation angle of the arc
style: Style of the arc
text: Centered text
textsize: Font size of the text
textstyle: Style of the centered text
Let’s explore two examples.
 1from drawlib.apis import *
 2
 3config(width=100, height=50, grid_only=True)
 4arc(xy=(25, 25), width=30, height=20, angle_start=0, angle_end=135)
 5arc(
 6    xy=(75, 25),
 7    width=40,
 8    height=30,
 9    angle_start=0,
10    angle_end=135,
11    angle=45,
12    text="arc",
13)
14save()
Handling angles is similar to functions like donuts().
Please refer to its explanation for more details.
Here’s an example output:
arc()
chevron()
The chevron() function draws a chevron shape.
In addition to specifying width and height, it allows you to define the angle of the bottom-left corner using corner_angle.
The shape of the chevron varies based on this parameter.
This function takes the following arguments:
xy: X, Y coordinates
width: Width of the chevron
height: Height of the chevron
corner_angle: Angle of the bottom-left corner
mirror: Optionally reverses the chevron horizontally (default is False)
angle: Rotation angle of the chevron
style: Style of the chevron
text: Centered text
textsize: Font size of the text
textstyle: Style of the centered text
Let’s explore two examples:
1from drawlib.apis import *
2
3config(width=100, height=50, grid_only=True)
4chevron(xy=(25, 25), width=30, height=20, corner_angle=30)
5chevron(xy=(75, 25), width=35, height=25, corner_angle=60, mirror=True, angle=45, text="chevron()")
6save()
The shape of the chevron is influenced by corner_angle.
When mirror is set to True, the chevron is horizontally reversed.
Here is an example output:
chevron()
ellipse()
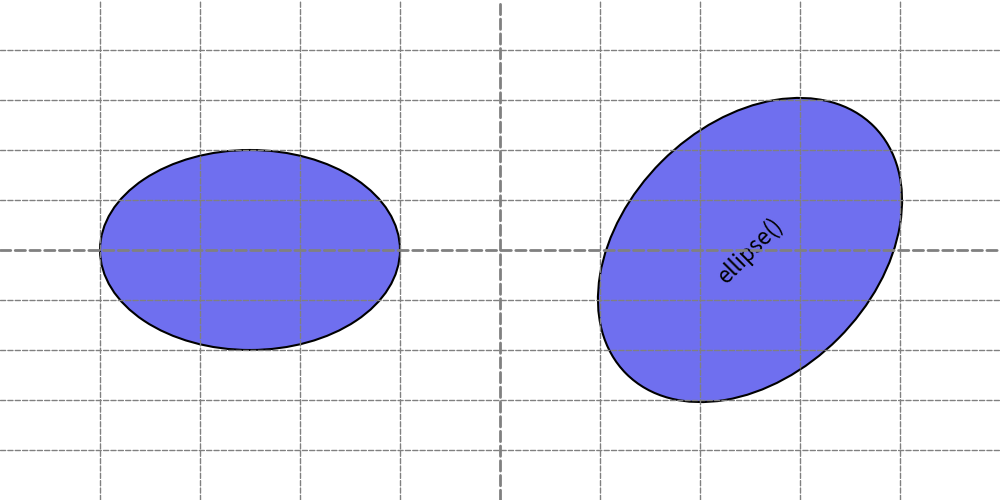
The ellipse() function draws an ellipse.
If the width and height are identical, it behaves similarly to the circle() function.
This function accepts the following arguments:
xy: X, Y coordinates
width: Width of the ellipse
height: Height of the ellipse
angle: Rotation angle of the ellipse
style: Style of the ellipse
text: Centered text
textsize: Font size of the text
textstyle: Style of the centered text
Let’s explore two examples:
1from drawlib.apis import *
2
3config(width=100, height=50, grid_only=True)
4ellipse(xy=(25, 25), width=30, height=20)
5ellipse(xy=(75, 25), width=35, height=25, angle=45, text="ellipse()")
6save()
Here is an example output:
ellipse()
parallelogram()
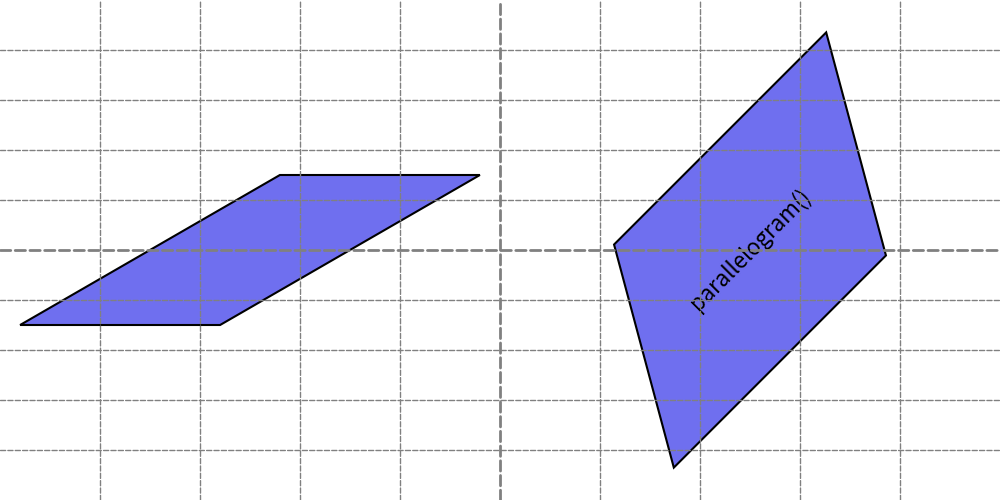
The parallelogram() function draws a parallelogram shape.
It allows you to specify the angle of the bottom-left corner using corner_angle.
Additionally, you can mirror the shape horizontally by setting the mirror parameter to True.
This function accepts the following arguments:
xy: X, Y coordinates
width: Width of the parallelogram
height: Height of the parallelogram
corner_angle: Angle of the bottom-left corner
mirror: Optionally reverses the parallelogram horizontally (default is False)
angle: Rotation angle of the parallelogram
style: Style of the parallelogram
text: Centered text
textsize: Font size of the text
textstyle: Style of the centered text
Let’s explore two examples.
1from drawlib.apis import *
2
3config(width=100, height=50, grid_only=True)
4parallelogram(xy=(25, 25), width=20, height=15, corner_angle=30)
5parallelogram(xy=(75, 25), width=30, height=20, corner_angle=60, angle=45, text="parallelogram()")
6save()
Here is an example output:
parallelogram()
rectangle()
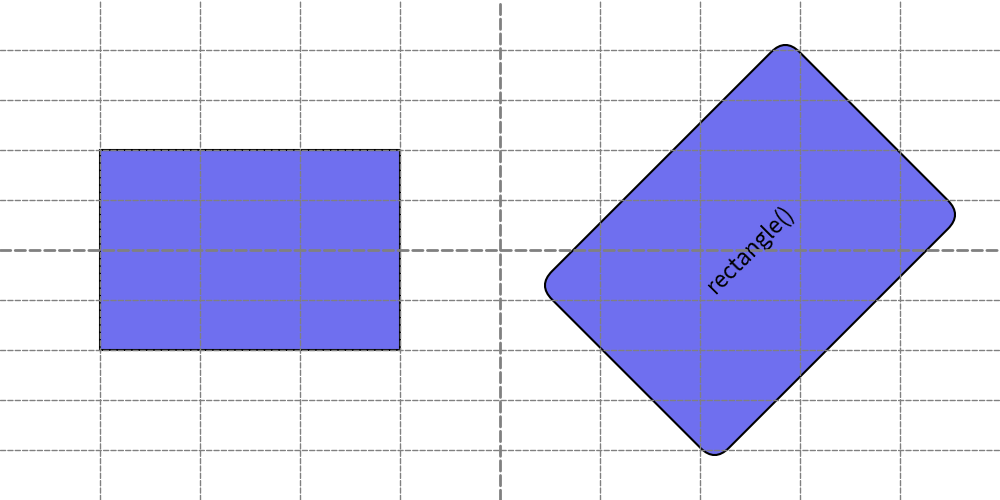
The rectangle() function draws a rectangle shape.
It allows you to specify the radius of the rounded corners using the r parameter.
This function accepts the following arguments:
xy: X, Y coordinates
width: Width of the rectangle
height: Height of the rectangle
r: Radius of the rounded corners (default is 0, resulting in sharp corners)
angle: Rotation angle of the rectangle
style: Style of the rectangle
text: Centered text
textsize: Font size of the text
textstyle: Style of the centered text
Let’s explore two examples:
1from drawlib.apis import *
2
3config(width=100, height=50, grid_only=True)
4rectangle(xy=(25, 25), width=30, height=20)
5rectangle(xy=(75, 25), width=35, height=25, r=2, angle=45, text="rectangle()")
6save()
Here is an example output:
rectangle()
rhombus()
The rhombus() function draws a rhombus shape, which is a diamond-like figure with equal sides.
This function accepts the following arguments:
xy: X, Y coordinates
width: Width of the rhombus
height: Height of the rhombus
angle: Rotation angle of the rhombus
style: Style of the rhombus
text: Centered text
textsize: Font size of the text
textstyle: Style of the centered text
Let’s explore two examples:
1from drawlib.apis import *
2
3config(width=100, height=50, grid_only=True)
4rhombus(xy=(25, 25), width=20, height=40)
5rhombus(xy=(75, 25), width=40, height=20, angle=45, text="rhombus()")
6save()
Here is an example output:
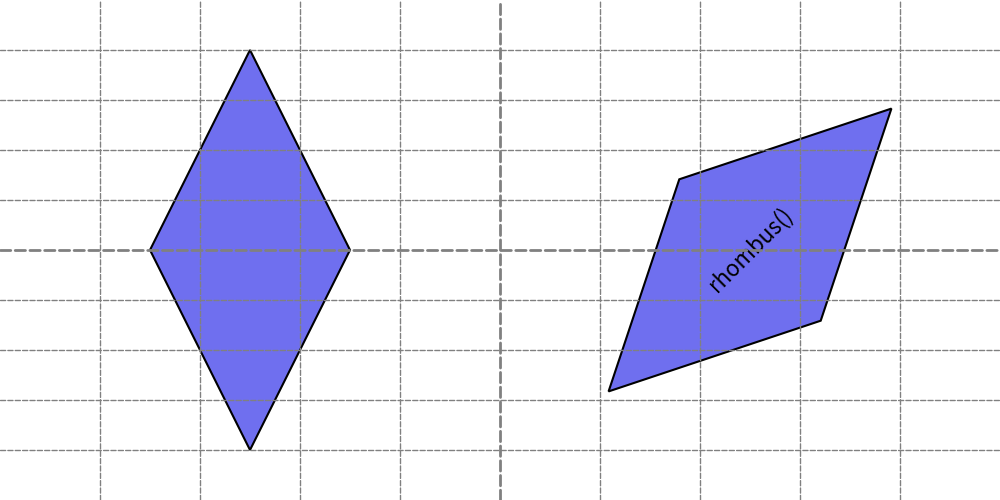
rhombus()
trapezoid()
The trapezoid() function draws a trapezoid shape, which has two different widths at its top and bottom edges.
The positioning of the top side relative to the bottom side can be adjusted using the top_width, bottom_width, and optionally top_start parameters.
This function takes these arguments.
xy: X, Y coordinates
width: Width of the trapezoid
height: Height of the trapezoid
bottom_width: Width of the bottom side of the trapezoid
top_width: Width of the top side of the trapezoid
top_start: Optional parameter to specify where the top side starts (default places the top side centered). If set to 0, the top side starts at the same position as the bottom side.
angle: Rotation angle of the trapezoid
style: Style of the trapezoid
text: Centered text
textsize: Font size of the text
textstyle: Style of the centered text
Let’s explore two examples:
 1from drawlib.apis import *
 2
 3config(width=100, height=50, grid_only=True)
 4trapezoid(xy=(25, 25), height=20, bottomedge_width=30, topedge_width=20)
 5trapezoid(
 6    xy=(75, 25),
 7    height=20,
 8    bottomedge_width=30,
 9    topedge_width=20,
10    topedge_x=0,
11    angle=45,
12    text="trapezoid()",
13)
14save()
Here is an example output:
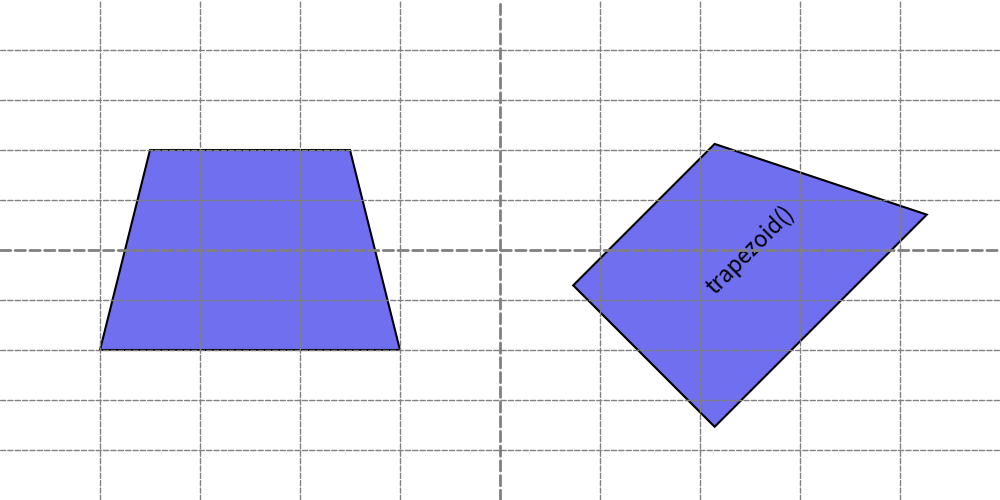
trapezoid()
triangle()
The triangle() function draws a triangle shape.
It has an optional parameter topvertex_xpos to specify where the top vertex is positioned horizontally.
If not specified, the triangle is drawn as an isosceles triangle with the top vertex aligned at the center of its width.
This function accepts the following arguments:
xy: X, Y coordinates
width: Width of the triangle
height: Height of the triangle
topvertex_xpos: Optional parameter to specify the horizontal position where the top vertex is pointed
angle: Rotation angle of the triangle
style: Style of the triangle
text: Centered text
textsize: Font size of the text
textstyle: Style of the centered text
Let’s explore two examples:
1from drawlib.apis import *
2
3config(width=100, height=50, grid_only=True)
4triangle(xy=(25, 25), width=30, height=20)
5triangle(xy=(75, 25), width=35, height=25, topvertex_x=0, angle=45, text="rectangle()")
6save()
Here is an example output:
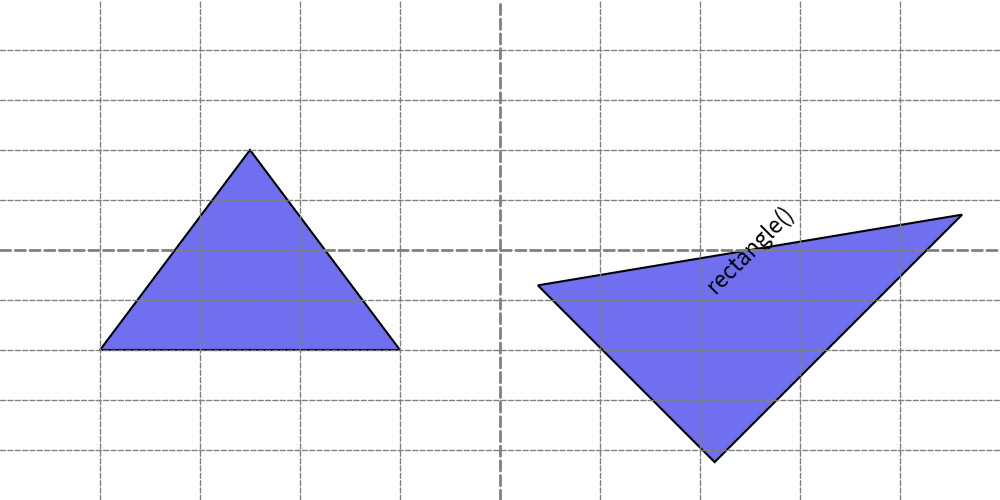
triangle()
In this example, inner text is drawn at the center of the right triangle shape.
However, the text extends beyond the shape’s boundaries.
In such situations, you can adjust the position where the text is drawn by specifying the xy_shift attribute of ShapeTextStyle.
For further details, refer to the shape style documentation.